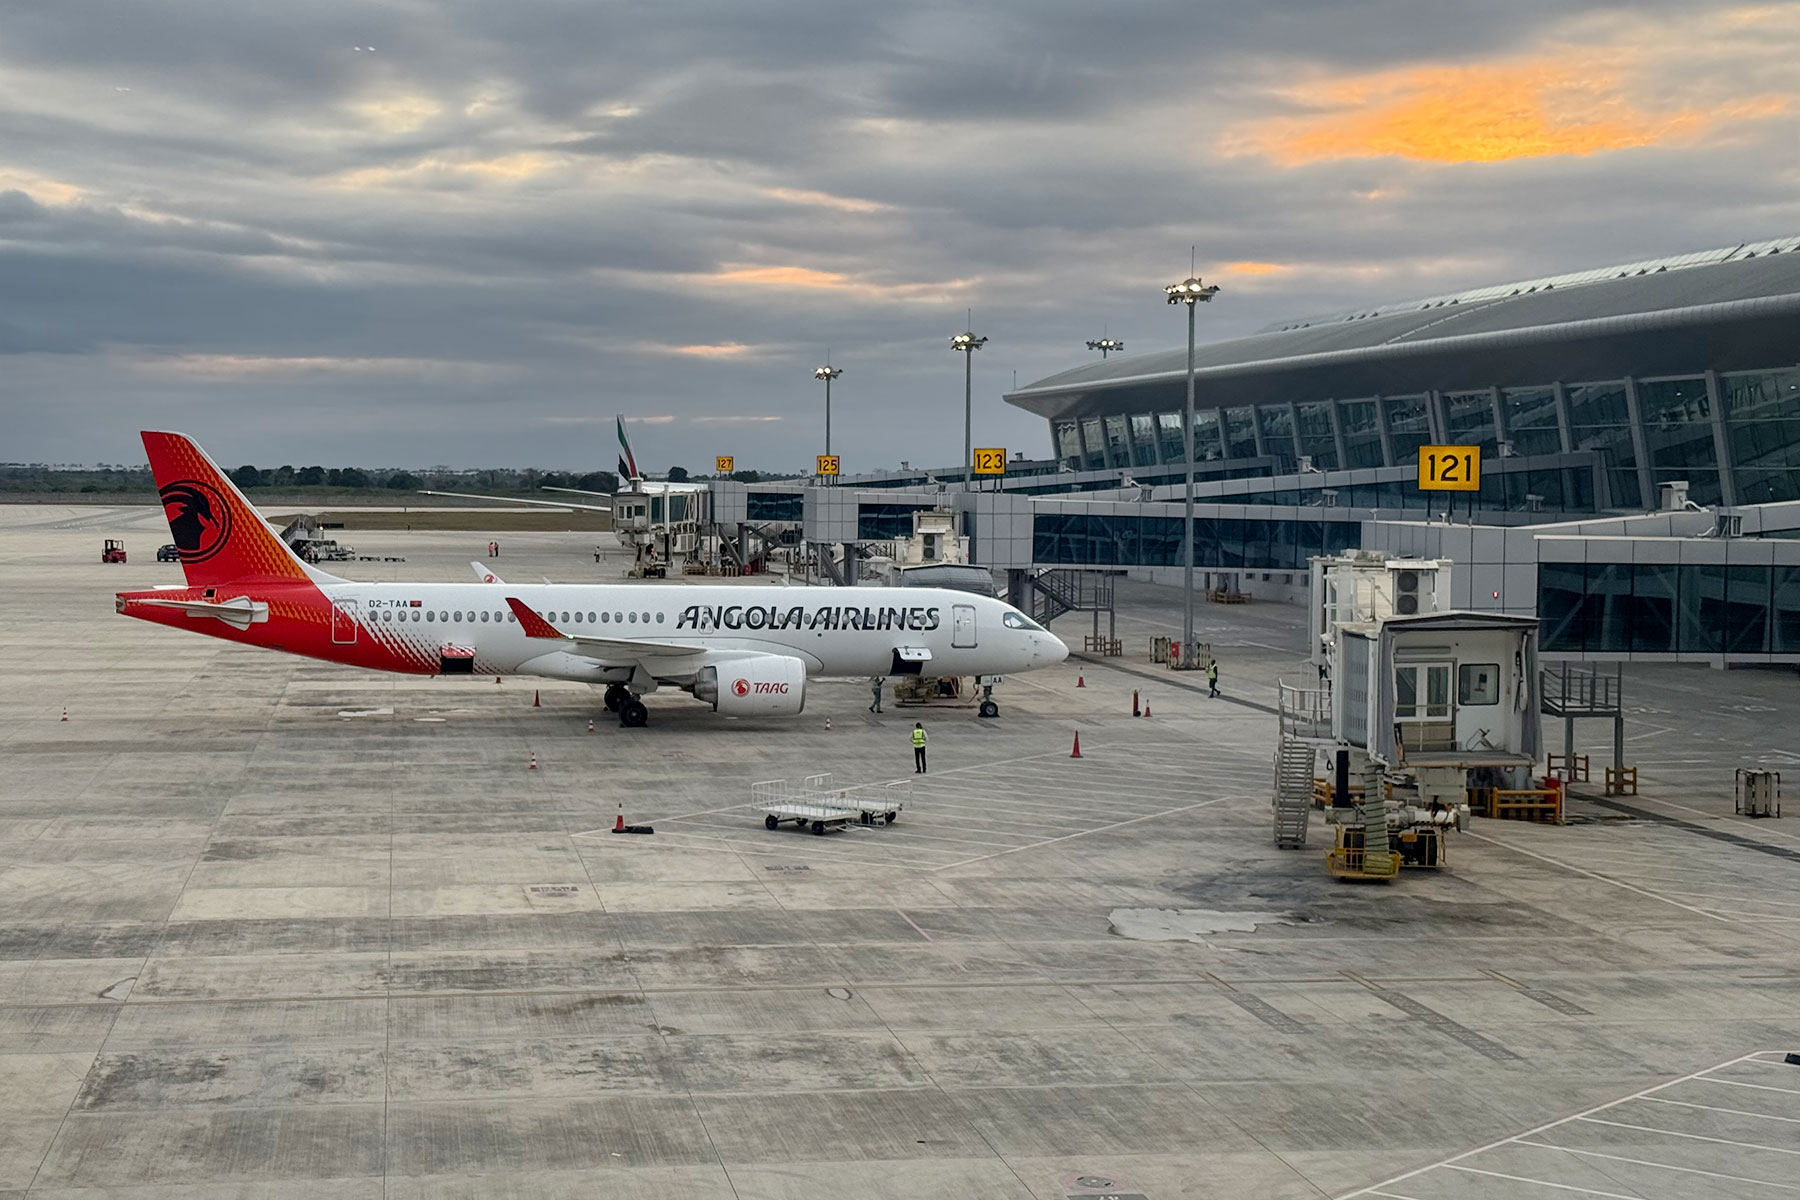
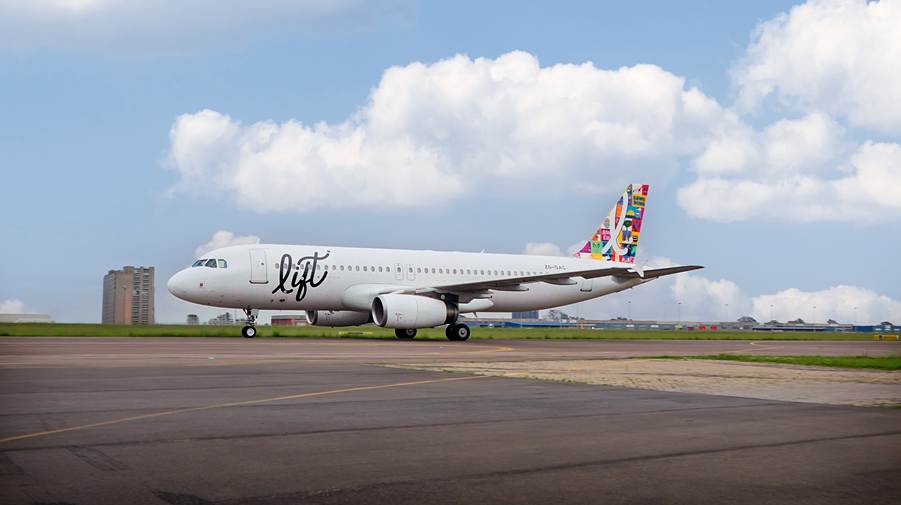
During the period under review, African airlines saw:
- demand rise by 7.1%
- with capacity increased by 5.3%
- for an 79.7% passenger load factor (the percentage of capacity taken up by the market)
- The African market accounted for 2.2% of the total global market during August.
While globally, demand grew 4.6% year-on-year in August, with capacity up 4.5% over the same comparative period.
The International Air Transport Association (IATA) released data for August 2025 global passenger demand with the following highlights:
- Total demand, measured in revenue passenger kilometres (RPK), was up 4.6% compared to August 2024. Total capacity, measured in available seat kilometres (ASK), was up 4.5% year-on-year. The August load factor was 86.0% (+0.1 ppt compared to August 2024), a record high for the month.
- International demand rose 6.6% compared to August 2024. Capacity was up 6.5% year-on-year, and the load factor was 85.8% (+0.1 ppt compared to August 2024).
- Domestic demand increased 1.5% compared to August 2024. Capacity was up 1.3% year-on-year. The load factor was 86.3% (+0.1 ppt compared to August 2024).
“August year-on-year demand growth of 4.6% confirms that the 2025 peak northern summer travel season reached a new record high. Moreover, planes were operating with more seats filled than ever, with a record load factor of 86%. Despite economic uncertainties and geopolitical tensions, the global growth trend shows no signs of abating, as October schedules are showing airlines planning 3.4% more capacity. Airlines are doing their best to meet travel demand by maximising efficiency, making it even more critical for the aerospace manufacturing sector to sort out its supply chain challenges,” said Willie Walsh, IATA’s Director General.
Air passenger market in detail – August 2025
| August 2025 (% year-on-year) | World share¹ | RPK | ASK | PLF (%-pt) | PLF (level) |
| Total Market | 100% | 4.6% | 4.5% | 0.1% | 86.0% |
| Africa | 2.2% | 8.9% | 6.6% | 1.7% | 80.2% |
| Asia Pacific | 33.5% | 6.1% | 5.5% | 0.5% | 85.9% |
| Europe | 26.7% | 4.2% | 4.2% | -0.1% | 87.9% |
| Latin America and Caribbean | 5.3% | 7.5% | 5.9% | 1.3% | 85.0% |
| Middle East | 9.4% | 8.4% | 7.0% | 1.1% | 83.8% |
| North America | 22.9% | 0.5% | 1.6% | -1.0% | 85.6% |
¹ % of industry RPKs in 2024
Regional Breakdown – International Passenger Markets
International RPK growth reached 6.6% in August year-on-year, and load factor reached a historic high. International traffic was by far the dominant driver of growth, accounting for 87% of the net increase in global RPK in August.
- Asia-Pacific airlines achieved a 9.8% year-on-year increase in demand. Capacity increased 9.5% year-on-year, and the load factor was 85.1% (+0.2 ppt compared to August 2024). Growth was driven by strong demand from China and Japan (+11.8% and +12% respectively).
- European carriers had a 5.3% year-on-year increase in demand. Capacity increased 5.3% year-on-year, and the load factor was flat (0.0 ppt compared to August 2024).
- North American carriers saw a 1.8% year-on-year increase in demand. Capacity increased 2.6% year-on-year, and the load factor was 87.5% (-0.6 ppt compared to August 2024). This was the fourth consecutive month of year-on-year declines in international PLF for North America.
- Middle Eastern carriers saw an 8.2% year-on-year increase in demand. Capacity rose by 6.9% year-on-year, and the load factor was 83.9% (+1.0 ppt compared to August 2024).
- Latin American airlines saw a 9.0% year-on-year increase in demand. Capacity climbed 9.3% year-on-year. The load factor was 84.7% (-0.2 ppt compared to August 2024).
- African airlines saw a 7.1% year-on-year increase in demand. Capacity was up 5.3% year-on-year. The load factor was 79.7% (+1.3 ppt compared to August 2024).
Domestic Passenger Markets
Domestic RPK rose 1.5% over August 2024 and contributed only 13% of the global increase in August RPK, down from 25% a year ago. US domestic load factor fell year-on-year for the eighth consecutive month. The sharp expansion in Brazil was helped by government efforts to promote tourism.
| August 2025 (% year-on-year) | World share¹ | RPK | ASK | PLF (%-pt) | PLF (level) |
| Domestic | 38.2% | 1.5% | 1.3% | 0.1% | 86.3% |
| Dom. Australia | 0.8% | 0.4% | 3.3% | -2.4% | 83.4% |
| Dom. Brazil | 1.1% | 12.7% | 8.1% | 3.4% | 85.1% |
| Dom. China P.R. | 11.3% | 3.4% | 3.1% | 0.3% | 85.5% |
| Dom. India | 1.7% | 0.4% | -0.2% | 0.5% | 83.2% |
| Dom. Japan | 1.0% | 6.0% | 3.1% | 2.4% | 89.6% |
| Dom. US | 14.4% | -0.2% | 1.1% | -1.1% | 84.2% |
¹ % of industry RPKs in 2024
Note: the six domestic passenger markets for which individual data are available account for approximately 30.2% of global total RPKs and 79.1% of total domestic RPKs.
Note: the six domestic passenger markets for which individual data are available account for approximately 30.2% of global total RPKs and 79.1% of total domestic RPKs.
